
View live population, charts & trends: Population of Tanzania
The median age in Tanzania is 17.4 years (2024).
A Total Fertility Rate (TFR) of 2.1 represents the Replacement-Level Fertility: the average number of children per woman needed for each generation to exactly replace itself without needing international immigration. A value below 2.1 will cause the native population to decline
See also: Countries in the world ranked by Life Expectancy
The 2024 population density in Tanzania is 77 people per Km2 (200 people per mi2), calculated on a total land area of 885,800 Km2 (342,009 sq. miles).
| # | CITY NAME | POPULATION |
|---|---|---|
| 1 | Dar es Salaam | 5,383,728 |
| 2 | Mwanza | 1,104,521 |
| 3 | Arusha | 617,631 |
| 4 | Mbeya | 541,603 |
| 5 | Morogoro | 471,409 |
| 6 | Zanzibar | 403,658 |
| 7 | Tanga | 393,429 |
| 8 | Tabora | 308,741 |
| 9 | Sumbawanga | 303,986 |
| 10 | Songea | 286,285 |
| 11 | Singida | 232,459 |
| 12 | Kigoma | 232,388 |
| 13 | Mpanda | 204,338 |
| 14 | Iringa | 202,490 |
| 15 | Moshi | 201,150 |
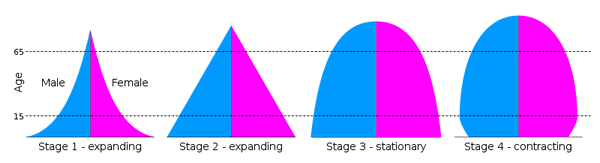
A Population pyramid (also called "Age-Sex Pyramid") is a graphical representation of the age and sex of a population.
Types:
Stages:
There are three types of age dependency ratio: Youth, Elderly, and Total. All three ratios are commonly multiplied by 100.
Youth Dependency Ratio
Definition: population ages 0-15 divided by the population ages 16-64.
Formula: ([Population ages 0-15] ÷ [Population ages 16-64]) × 100
Elderly dependency ratio
Definition: population ages 65-plus divided by the population ages 16-64.
Formula: ([Population ages 65-plus] ÷ [Population ages 16-64]) × 100
Total dependency ratio
Definition: sum of the youth and old-age ratios.
Formula: (([Population ages 0-15] + [Population ages 65-plus]) ÷ [Population ages 16-64]) × 100
NOTE: Dependency Ratio does not take into account labor force participation rates by age group. Some portion of the population counted as "working age" may actually be unemployed or not in the labor force whereas some portion of the "dependent" population may be employed and not necessarily economically dependent.